
The Standard Deviation Formula and Its Application
Understanding statistical data can seem daunting, especially if you are new to the field. One of the fundamental statistical tools that comes in handy in data analysis is the standard deviation.
At Standard Deviation Calculator, we believe in making complex statistical calculations easier. Today, we're going to explain the standard deviation formula and demonstrate how to use it.
What is Standard Deviation?
Standard deviation is a mathematical term used in statistics that measures the amount of variation or dispersion in a set of values. It is a popular way to gauge the volatility of a data set or an investment portfolio, among other things.
The Standard Deviation Formula:
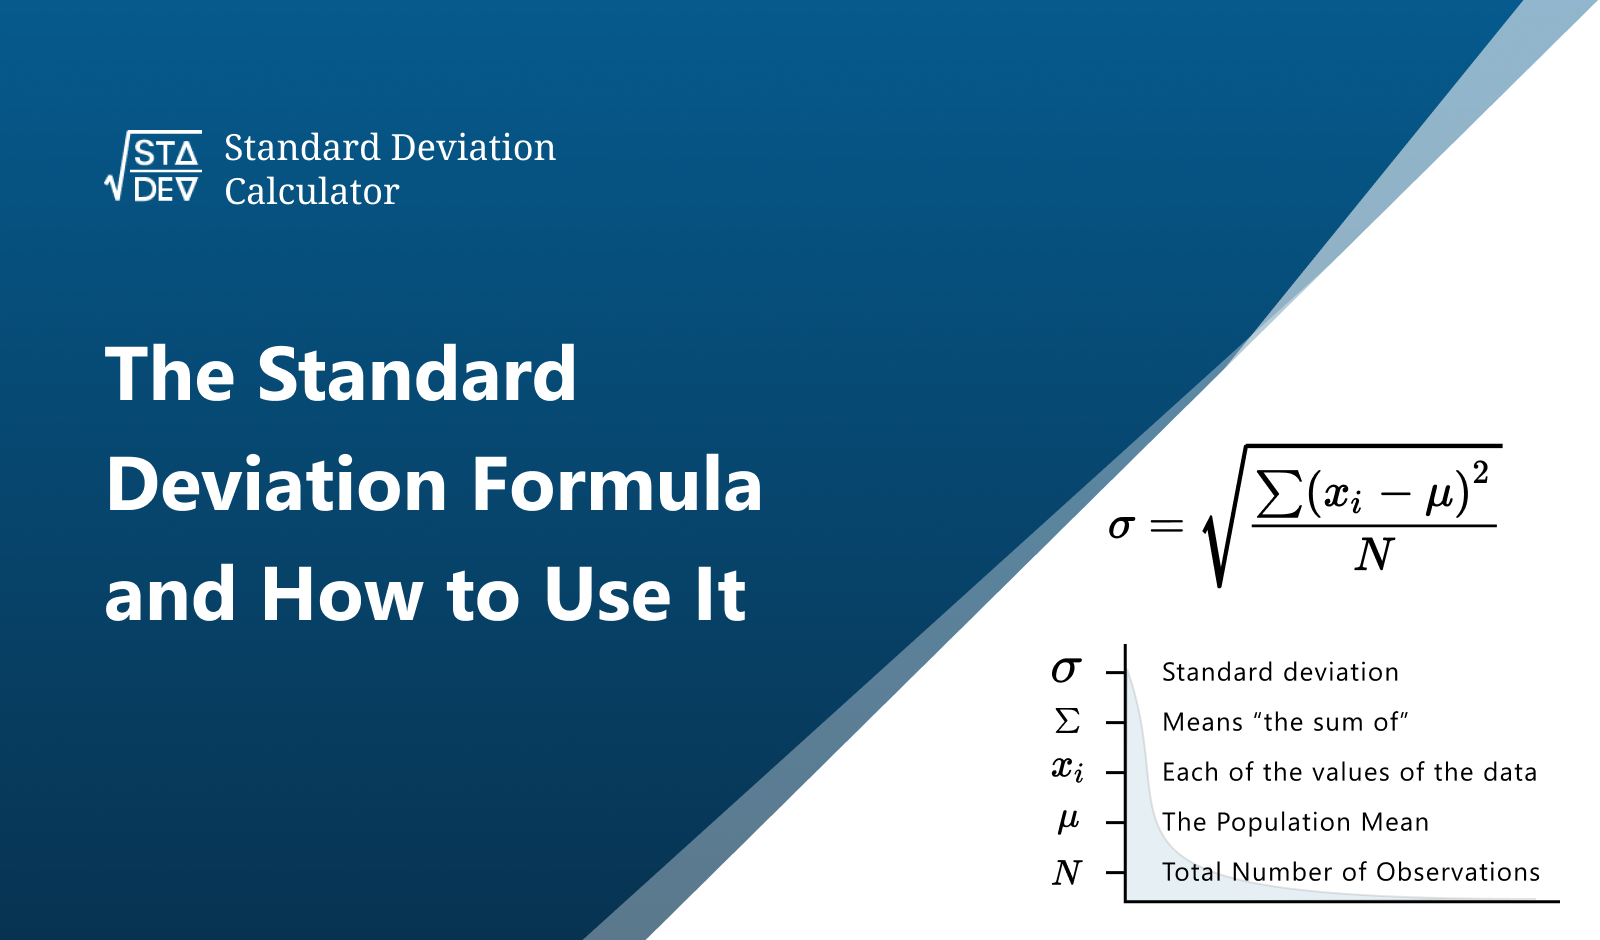
The formula for standard deviation can be represented as follows:
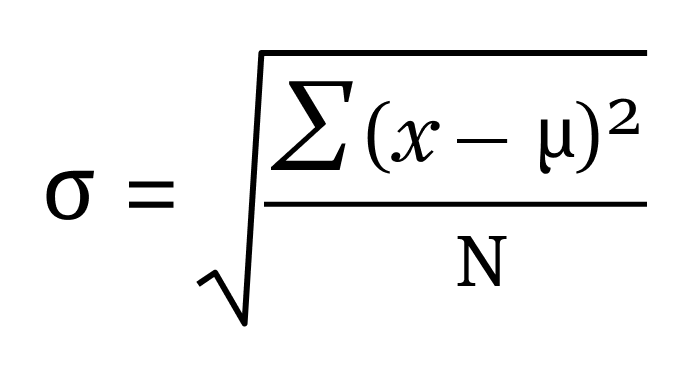
Here:
- σ represents the population standard deviation
- xi represents each value from the population
- μ is the population mean
- N is the size of the population
For a sample standard deviation, you replace N with (n-1) where n is the sample size.
Using the Standard Deviation Formula:
The formula might seem slightly complicated at first glance, but it's quite straightforward when broken down into steps.
Step 1:
Find the Mean (μ): Add all numbers in your dataset and divide by the number of items (N) in your dataset.
Step 2:
Subtract the Mean and Square the Result: For each number in your dataset, subtract the mean and then square the result. This gives you a list of squared differences.
Step 3:
Find the Average of Those Squared Differences: Add all the squared differences together and divide by N for the population or n-1 for the sample.
Step 4:
Take the Square Root: Finally, take the square root of the result from step 3. This final result is your standard deviation.
While this manual calculation process provides a fundamental understanding of the concept, our Standard Deviation Calculator can do the job in a matter of seconds, allowing you to focus more on interpreting the results.
Pros and Cons of Using Standard Deviation:
Like all statistical measures, standard deviation comes with its advantages and limitations. Let's examine them in the table below:
Pros | Cons |
Provides a measure of data dispersion | Can be influenced by extreme values (outliers) |
Widely recognized and used | May not be fully indicative of data distribution |
Useful in a variety of fields | Requires understanding for proper interpretation |
Despite these limitations, standard deviation remains a critical tool for understanding variability within a data set. When used wisely and interpreted correctly, it can provide valuable insights into your data.
Conclusion:
Grasping the concept of standard deviation and how to use the standard deviation formula can be quite beneficial, whether you're in finance, science, psychology, or any field that relies on data analysis. Remember, always use our Standard Deviation Calculator for quick, accurate, and easy calculations.
Stay tuned to our blog for more insights into statistical tools and their applications. With the right tools and understanding, you can transform data into powerful insights.
