
The Role of Standard Deviation in Probability Theory
In the world of statistics and probability, one measure has consistently proved to be of critical significance – the standard deviation. Providing insights into the dispersion of a dataset, the standard deviation is an essential element in the toolbox of statisticians, data scientists, and researchers alike.
This blog aims to delve deeper into the role and importance of the standard deviation in probability theory.
Diving into Standard Deviation:
Standard deviation serves as a numerical value that indicates the degree to which individual data points deviate from the mean. A smaller standard deviation indicates that data points tend to be very close to the mean, while a larger one indicates the data points are spread out over a larger range.
To help grasp this, consider the following datasets and their corresponding standard deviations:
Dataset | Standard Deviation |
2, 4, 6, 8, 10 | 3.162 |
5, 10, 15, 20, 25 | 7.905 |
10, 20, 30, 40, 50 | 15.811 |
As illustrated, the standard deviation increases with the spread of data from the mean.
The Intersection of Standard Deviation and Probability Theory:
The standard deviation's essential link to probability theory becomes evident when understanding the behavior of random variables. Let's see how:
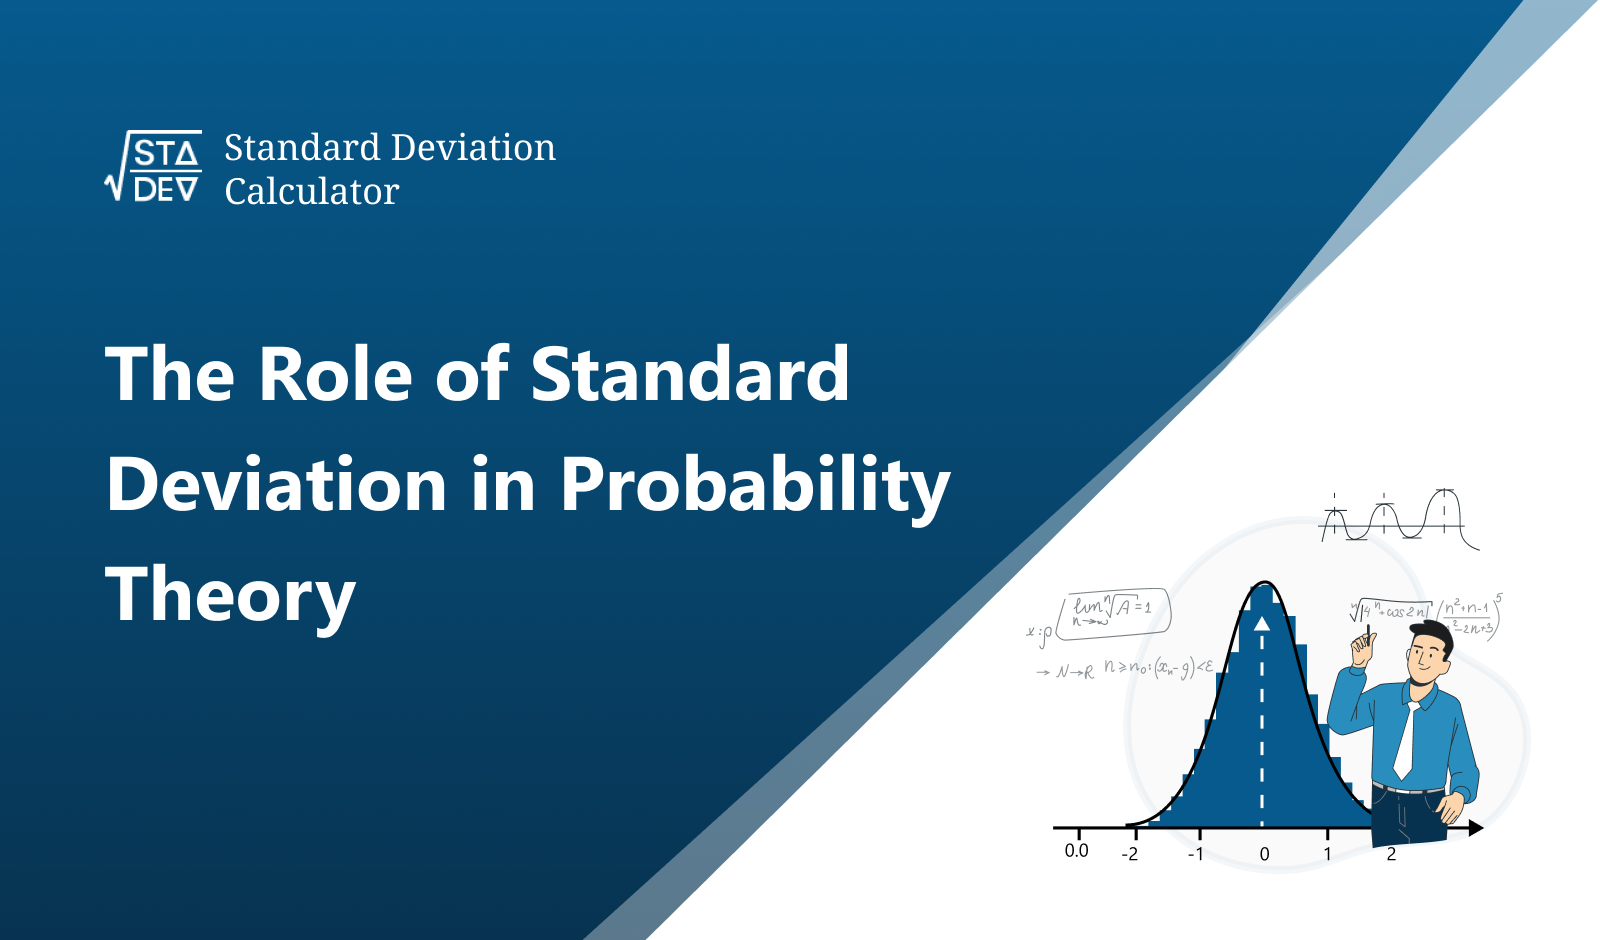
Central Limit Theorem:
This theorem holds that the distribution of the sum (or average) of a large number of independent, identically distributed variables will be approximately normal, regardless of the underlying distribution. The standard deviation determines the breadth of this distribution.
Z-Scores:
Z-scores, or standard scores, measure how many standard deviations an element is from the mean. As such, the standard deviation is integral to the computation and interpretation of z-scores.
Confidence Intervals:
Confidence intervals for predicting a range of plausible values for an unknown parameter (e.g., the mean) are based on the standard deviation of the estimates.
Using a standard deviation calculator can simplify these processes, making it easier for researchers to determine the reliability and validity of their datasets.
FAQs:
Q 1: What does a high standard deviation signify?
A high standard deviation indicates that data points in a dataset are spread far from the mean and from each other, implying high variability within the dataset.
Q 2: What's the relation between standard deviation and mean?
The standard deviation is a measure of the dispersion of data around the mean.
Q 3: How does standard deviation impact probability calculations?
In probability theory, the standard deviation measures the extent of variability or uncertainty associated with a particular event or experiment. This directly impacts the likelihood of specific outcomes.
Q 4: Can the standard deviation be calculated without a tool?
Yes, it can be calculated manually, though using a standard deviation calculator is generally more accurate and efficient.
Summary:
In summary, the standard deviation plays an integral role in probability theory, shaping the way we understand and interpret data. By using tools like a standard deviation calculator, statisticians can obtain more precise measurements, thereby improving the accuracy of their predictions and analyses.
This highlights the undeniable importance of the standard deviation in statistics and beyond.
