Mean calculator
Find the mean of a discrete data set and know the different properties of the data using this calculator.
For instance, the mean calculator along with giving the mean with a step-by-step solution gives the total number of data, sorted array, and smallest and largest data values.
What is the mean of a data set?
One word to describe the mean is “average value”. A value that lies between both extremes of the data.
There are other types of means like harmonic and geometric but the basis of it all or the “Actual mean” is the arithmetic mean.
Mean formula:
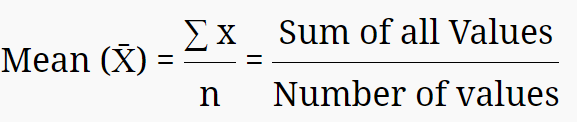
Small X bar is the notation used for mean in mathematics although it is represented differently in statistics. N is the number of data set values. Sigma notation means summation.
How to calculate the mean?
Find the summation of the whole data. Count how many values are present in the data. Divide the summation by that number. The answer is the mean of the data.
Alternatively, use the mean calculator.
Example of Calculating the Mean for Ungrouped Data:
Find the mean of the following data set:
10, 10, 34, 23, 54, 9, 10, 2, 38, 23, 38, 23, 21
Solution:
Follow these steps to calculate the mean of Ungrouped data
Alternatively, you can use a mean calculator for Ungrouped data to streamline this process.
Step 1: Add the data.
= 2+9+10+10+10+21+23+23+23+34+38+38+54
= 295
Step 2: Count the values.
There are a total of 13 values.
Step 3: Divide the sum by 13.
= 295/13
= 22.692
The mean of the Ungrouped data is 22.692.
Example of Calculating the Mean for Grouped Data:
Consider the following data set which represents the marks obtained by students in a test. The marks are grouped into intervals:
Marks (Interval) | Frequency (f) |
0 - 10 | 3 |
10 - 20 | 5 |
20 - 30 | 8 |
30 - 40 | 4 |
40 - 50 | 2 |
Calculate the mean of the given data.
Solution
Follow these steps to calculate the mean of grouped data
Alternatively, you can use a mean calculator for grouped data to streamline this process.
Step 1: Calculate the Midpoints
Marks (Interval) | Frequency (f) | Midpoint (x) | f⋅x |
0 - 10 | 3 | 5 | 15 |
10 - 20 | 5 | 15 | 75 |
20 - 30 | 8 | 25 | 200 |
30 - 40 | 4 | 35 | 140 |
40 - 50 | 2 | 45 | 90 |
Step 2: Calculate the Sum of f⋅x
Σ(f⋅x) =15+75+200+140+90=520
Step 3: Calculate the Total Frequency
Σf = 3+5+8+4+2=22
Step 4: Calculate the Mean
Mean=Σ(f⋅x)/ Σf
=520 / 22
≈23.64
The mean of the grouped data is 23.64.
Frequently Asked Questions
How to find the mean?
The mean of any type of data set either dealing with the sample/population data set and a data set of positive or negative numbers then find its value using the mean formula by following the below two simple steps.
Firstly, find the sum of the values by adding all of them.
By using its formula divide the sum with the number of elements of the given data set.
Is the Average Same as the Mean?
Yes, in statistics and mathematics, the mean of any data set is the same as the average. The mean is known as the sum of all values of the sample/population data divided by the total number of elements in any sample/population data set.
How to find the Mean of Negative Numbers?
The mean of the negative numbers is found similar to the finding of the mean of the positive data set by adding or subtracting the data values according to the given sign and dividing by the number of elements of any data set.
What is the relationship between mean, median, and mode?
The relationship between the mean, median, and mode can be expressed by Karl Pearson’s Empirical Relationship equation which shows the skewed distribution and is stated as:
3 × Median = Mode + 2 × Mean
What is the mean of the first 5 composite numbers?
The mean of the first five composite numbers by using the mean formula is equal to the “7.4” and the first five composite numbers are 4, 6, 8, 9, and 10. To verify this value use our above mean calculator that provides the answer to any number of data sets.