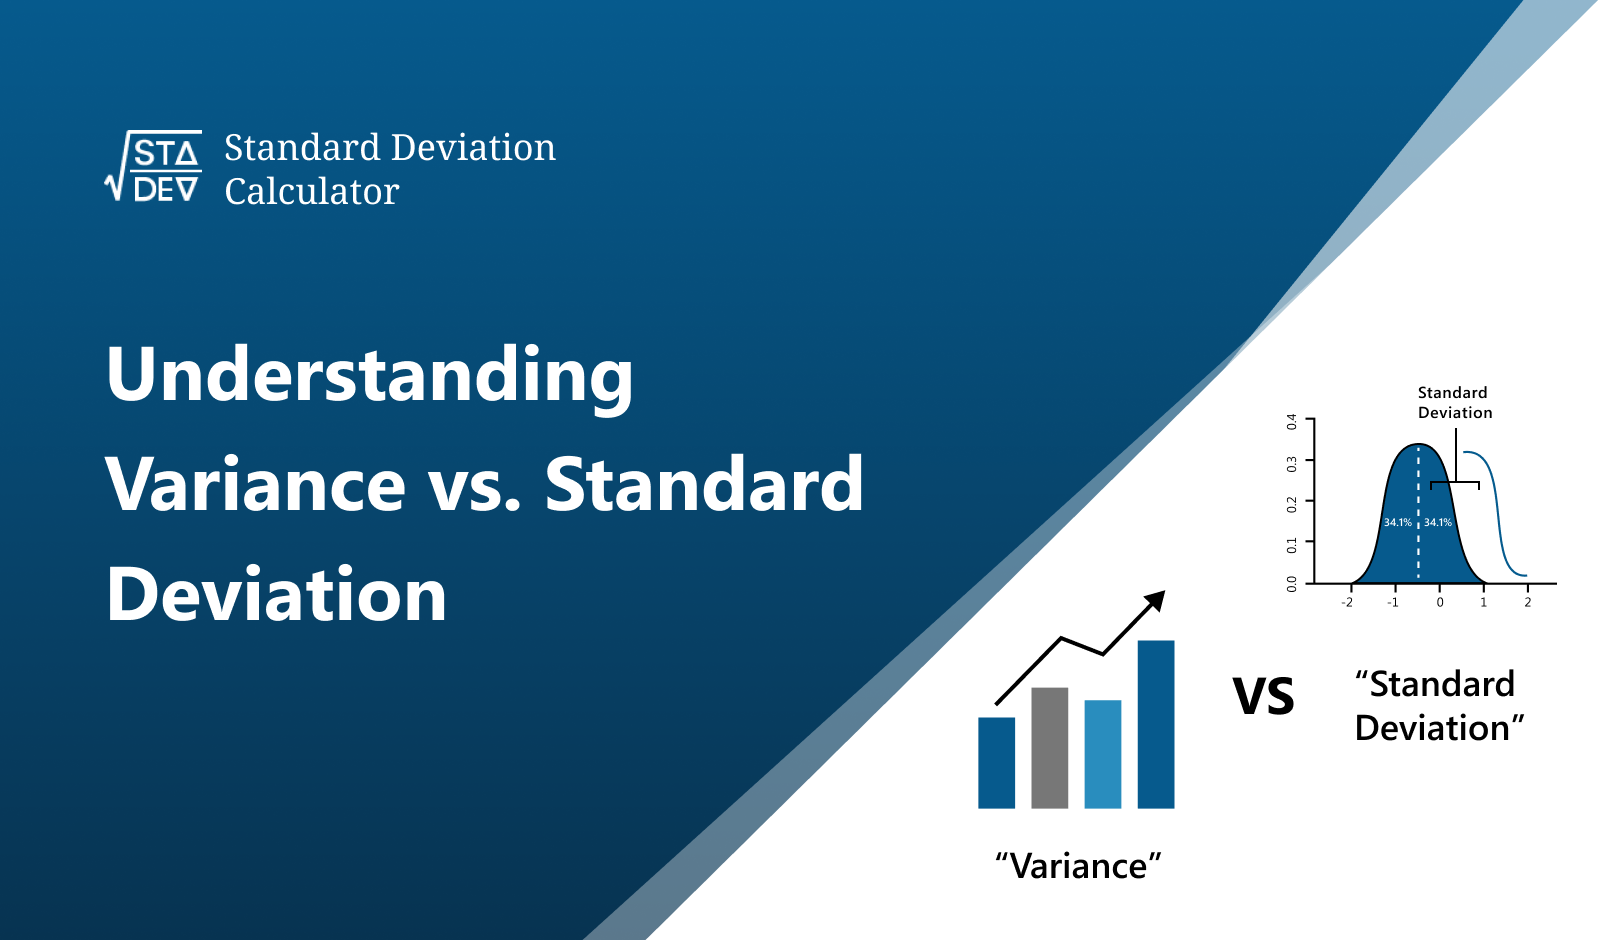
Understanding Variance vs. Standard Deviation:

In statistics, two pivotal concepts that are frequently used to describe data are "variance" and "standard deviation". While they are related, they are not identical. This blog post will help demystify these concepts and draw distinctions between them.
In addition, we'll look at two incredibly helpful tools, the Standard Deviation Calculator and the Variance Calculator, that simplify these calculations. Let's dive into these fundamental statistical concepts.
What is Variance?
Variance is a statistical measure that conveys the variability or dispersion of a dataset. In layman's terms, it calculates how far each number in the set is from the mean (average) and hence from every other number in the set.
High variance implies that the data points are far from the mean and each other, signaling a wide range of values. On the other hand, low variance indicates the data points are closely packed to the mean and each other, representing a narrow range of values.
What is Standard Deviation?
Standard deviation is another statistical measure that gauges the spread of data points. However, unlike variance, the standard deviation is expressed in the same unit as the original data because it's the square root of the variance.
A low standard deviation reveals that data points are generally close to the mean, while a high standard deviation suggests that the data is dispersed over a larger range of values.
To measure standard deviation, you often need to perform many calculations and have a good understanding of statistical terms like mean, variance, differences, or many more. However, you can calculate the range to gain an initial understanding of variability, especially during early data exploration.
Variance vs. Standard Deviation: A Comparison
Variance and standard deviation, while measuring the same concept of spread in a data set, have different applications and interpretations due to their units. Here's a comparison table to help visualize the differences:
Variance | Standard Deviation | |
Definition | Measures how far each number in the set is from the mean, and from each other | The square root of the variance |
Unit | Square of the original data unit | Same as the original data unit |
Interpretation | Theoretical importance in statistics | More practical and understandable for real-world applications |
When to use | When dealing with multiple variables in complex statistical calculations | When you need to interpret and present data |
Simplifying Standard Deviation and Variance Calculations:
While variance and standard deviation are crucial concepts in statistics, they are often complex and time-consuming to calculate. Fortunately, online tools like the Standard Deviation Calculator and Variance Calculator make these calculations more accessible.
The Standard Deviation Calculator helps you to calculate the standard deviation effortlessly, taking the hassle out of difficult problems.
Similarly, the Variance Calculator can save you time when computing the variance of a dataset, making it an indispensable tool for both students and professionals.
These tools are designed to be user-friendly, allowing anyone to calculate variance and standard deviation with ease, regardless of their mathematical prowess.
Conclusion:
Understanding variance and standard deviation is a critical step in interpreting data effectively. They provide key insights into how dispersed data is, how volatile it can be, and how much it deviates from the average.


