Hypothesis testing calculator is an online statistical tool that helps to perform hypothesis tests to reject or accept the null hypothesis “H0” by finding test statistics, p-value, & critical value for given data. It performs hypothesis analysis for a defined H0 & significance level by using a related formula for two selections of data, i.e., “raw data” and “mean, SD, & sample size”.
What is Hypothesis Testing?
Hypothesis testing is a statistical method that provides a structured framework for researchers or analysts to claim evidence (reject or fail to reject the null hypothesis). This test is performed in any scientific experiment to assess which hypothesis is more likely to be true for the population, based on sample data.
It involves the formulation of two hypotheses: the null hypothesis “H0,” which represents default information, and the alternative hypothesis “Ha,” which shows the claim that we want to test. The hypothesis testing can be performed by using different test such as t-test, p-test, z-test, ANOVA test, and chi-square test.
To do this, use the different formulas according to the test and find test statistics & critical values that compare to reject or accept “H0” according to the rule of the respective test.
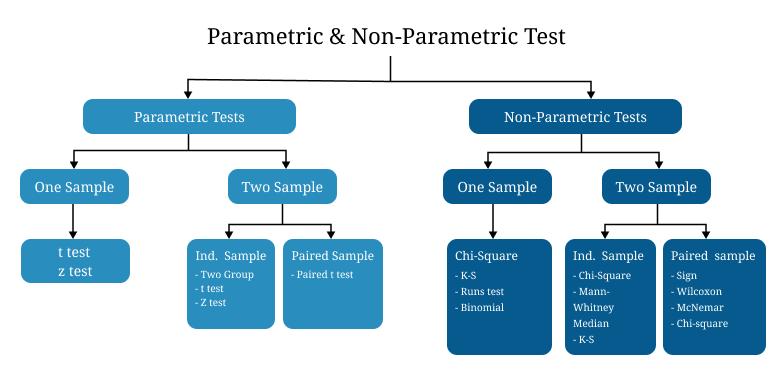
Types of Hypothesis Testing & Its Formulas
Hypothesis testing can be divided into two different types on the basis of data types or research questions which used in statistical analysis. The types are named as parametric and non-parametric, which can also be further distributed based on groups of sample data, as one-sample or two-sample.
How to Perform Hypothesis Testing?
Hypothesis testing is a systematic process that is based on some realistic steps to provide evidence for the rejection or acceptance of the assumed claim for given population data. To perform it manually, you can follow the below steps:
- First, state the null (H0) & alternative hypotheses (Ha).
- Note all data values such as group data, significance level (α), mean, SD, and sample size.
- Choose the appropriate hypothesis test according to the given data groups, sample size & assumptions such as Z, T, ANOVA, or chi-square test.
- Compute the test statistic value by using the chosen test’s formula (i.e., T, Z, or χ2 formula).
- Now, evaluate the critical value for the selected test by using the “α” & “df” values with appropriate table. For instance, critical value use our critical value calculator.
- Finally, compare the test statistic value with critical value to conclude the results (reject or accept H0) by selected test rule.
By using these steps, you can perform testing and make a decision to select the appropriate hypothesis. Alternatively, you can use our above hypothesis testing calculator to perform a quick and accurate hypothesis test for multiple options in a few clicks.
Hypothesis Testing Example
Here, we perform the hypothesis testing example by using an appropriate test for the given data and explain with detailed steps that help to understand the process of hypothesis testing. It also helps to select the right hypothesis for given data, i.e., mean, standard deviation, and α values.
Example: A battery company claims the average life of their batteries is 100 hours. An analyst selects 12 batteries to test them and finds that their life is 102 hours with a 5% significance level & deviation of 5 hours. Test whether the company’s claim is true or not.
Solution:
In the above data, the sample size is less than 30 & population standard deviation (σ) is unknown; then we apply the t-test hypothesis testing for this analysis.
Step 1: State the hypotheses
Null Hypothesis (H0): μ =100 (mean life is 100 h)
Alternative Hypothesis (Ha): μ≠100 (mean life differs from 100 h)
Step 2: Note the values from the given data.
α = 0.05, x̄ = 102, S = 5, μ = 100, n = 12
Step 3: Determine the t-statistical value by using Student’s t-test formula.
t = (x̄ - μ) / (S / √n)
t = (102 – 100)/(5/√12) = 2/1.443 = 1.386
Step 4: Now, find t-critical value by using “α” and “df” value in the t-distribution table.
df = n-1 = 12 -1 = 11, α = 0.05
T(11, 0.05) = ±2.2010
Step 5: Finally, compare the test statistic with critical value to conclude the results.
Since t calculated “1.386” does not fall in the rejection region (t<-2.201 or t>2.201), then we fail to reject H0.
Conclusion
So, there is not sufficient evidence to reject the company’s claim. Moreover, to verify these results, use our above hypothesis test statistics calculator.
Frequently Asked Questions
What is hypothesis testing?
It is a statistical method that is used to compare the sample evidence to claims about the population and decide whether it is likely true or not & select the favorable hypothesis.
How to do hypothesis testing?
For quick testing, use our statistical hypothesis testing calculator and select the appropriate assumptions. However, if you want to do it manually, then follow the steps as in the above example.
What is a type 1 error in hypothesis testing?
It’s like a “false alarm” when a researcher concludes false results by rejecting a null hypothesis even though it is true.
Why is hypothesis testing important?
Hypothesis testing is a systematic method that supports a theory or a population which used for analysis. It provides an authentic way to draw conclusions or claims rather than relying on guesswork or personal opinions.
What is level of significance in hypothesis testing?
The level of significance is a predefined probability that works as a deciding factor for the rejection of the null hypothesis, but in actual is true. It becomes a cause of Type I error and is shown by “α”.